Summary
- Historical performance of Apple and Microsoft shows why investors need to look beyond the Price/Earnings ratio.
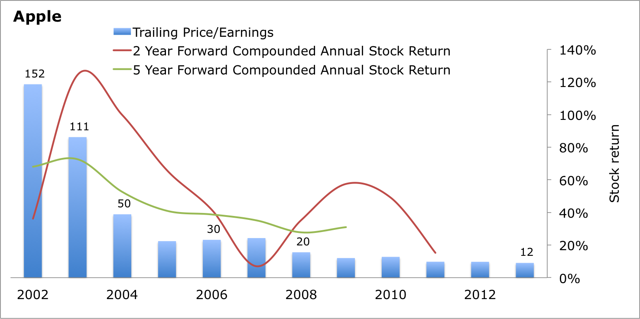
- You would have made more money investing in Apple when it was trading at a P/E multiple of 100+ than when it was trading at around 10.
- Facebook, Apple, and Yahoo are relatively cheap at current levels, while LinkedIn is the most expensive of the lot.
Objective
While the P/E ratio is a good benchmark to compare companies and industries, it may not be as relevant for high growth companies. I looked at historical data to understand whether there is any correlation between P/E ratios and stock returns for high growth companies, and used that analysis to identify ‘cheap’ and ‘expensive’ technology stocks.
Methodology, Sources and Limitation Of Analysis
Data has been gathered mainly from published financial statements, Yahoo Finance, and Google Finance. I’ve tried to gather as much historical data as can be relied upon. However, since they have been extracted from various sources, and while I’ve tried to make sure that prices have been updated for splits and dividends, I request you to consider this data as indicative, and to do your own due diligence before making any decisions.
- Stock prices, unless stated otherwise, are average prices for the year;
- Consensus estimates can differ significantly by aggregator, but for the purposes of this analysis, I’ve used those reported by Yahoo Finance. Also, it’s not clear if the figures for Facebook consider the dilution in EPS because of the WhatsApp acquisition;
- Price/Earnings ratio, unless stated otherwise, is ‘average’ stock price for the year divided by diluted earnings per share.
- Growth as part of the PEG ratio is considered to be the forward compounded annual growth rate for 2 years from the stated year.
- Net Cash is calculated at (cash + short-term investments + long-term investments at ‘book’ value – long-term debt)
There are several other factors that could have affected the trends. Hence, this analysis cannot be looked upon in isolation, and should be considered in the light of your fundamental views of the stock.
Historical Analysis – Apple and Microsoft
Let’s start with looking at Apple (NASDAQ:AAPL). If you would have invested in the stock when it was quoting at a trailing P/E of 152 times in 2002, you would have made compounded annual returns of 35% over the next two years, and 70% over the next five years. Your returns would have been even higher, had you invested in 2003. In fact, what is interesting to see is that as the P/E ratio of the stock declined to close to 10 times by 2011, the returns also reduced significantly. Yes, this is because of the decline in the growth of earnings of the company. Let’s look at that in the next chart.
Source: Own Analysis, Published Financial Statements, Yahoo Finance
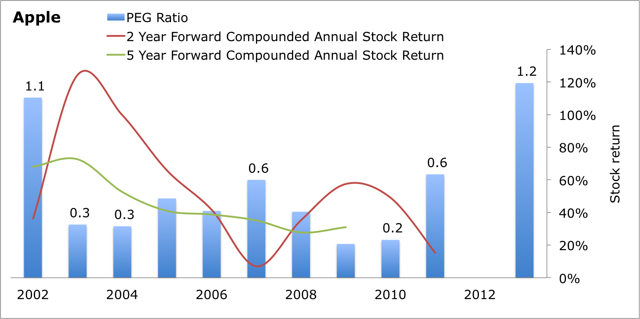
If we now consider growth in the chart i.e. include Price Earnings Growth ratio (P/E divided by growth), you can see that returns were higher when you invested in the stock at a low PEG ratio. You would have had maximum returns if you had invested in 2003 and 2004.
Note that there is no PEG value for 2012 because there was a minor decline in EPS from 2012-2014, and PEG ratio doesn’t work with negative growth rates.
Source: Own Analysis, Published Financial Statements, Yahoo Finance
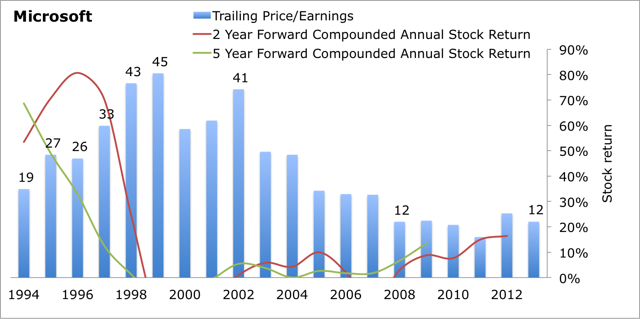
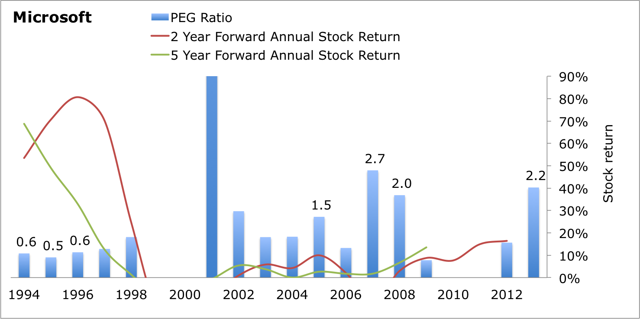
Let’s now see if the same holds true for Microsoft (NASDAQ:MSFT) in the chart below. Please note that this chart has been affected by the 2000 bubble, and hence tread with caution. Highest returns for the stock came in for those who invested during the 1994-97 period when PEG ratios were really low and even when the P/E ratio was much higher than we have seen in recent times.
Source: Own Analysis, Published Financial Statements, Yahoo Finance
Source: Own Analysis, Published Financial Statements, Yahoo Finance
A similar analysis for Google would have been useful, however, the recent split has made it difficult to get reliable data easily. Also, I’ve not included any companies that have failed after having a high P/E multiple in the past. This is because the companies considered below have strong products or market share, and hence, less likely to fail.
Ideal PEG Ratio
There is no set industry standard for this, but I prefer to buy companies that have a PEG ratio of less than 1, i.e. their 2-3 year forward compounded growth rate is higher than their P/E ratio, irrespective of how high the P/E ratio itself is.
Valuations Today
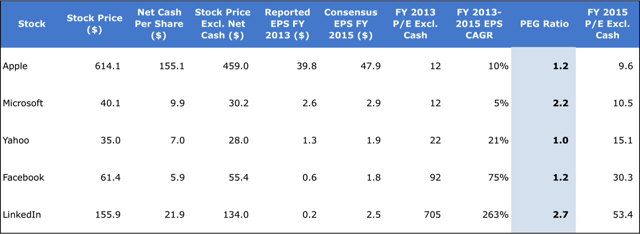
When we work out the PEG ratio for some of the top tech companies which had positive EPS in 2003, you can see that Facebook (NASDAQ:FB), Apple and Yahoo (NASDAQ:YHOO) are relatively cheap at a PEG ratio of 1.0-1.2 even though Facebook’s trailing and forward P/E ratios are high, and LinkedIn is the most expensive at 2.7.
Source: Own Analysis, Published Financial Statements, Yahoo Finance, Google Finance
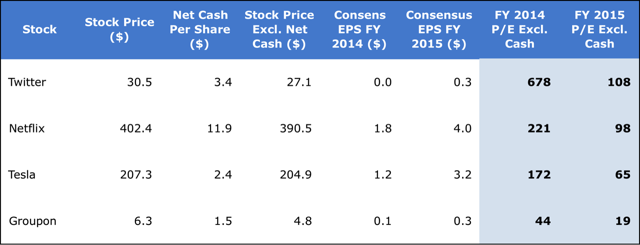
For companies that didn’t report a positive EPS in 2013, I do not have 2016 consensus figures, and it’s also too far in the future for a rapidly changing industry. Hence, I performed a comparison based on forward P/E ratios for Twitter (NYSE:TWTR), Netflix (NASDAQ:NFLX), Tesla (NASDAQ:TSLA) and Groupon (NASDAQ:GRPN). The question is whether these companies can grow faster than their current P/E ratios i.e. their PEG ratio is less than 1? It may also be better to look at their market opportunity and market cap to decide their real worth.
Source: Own Analysis, Published Financial Statements, Yahoo Finance, Google Finance
My Top Picks
- Facebook – As a user, advertiser, and web developer, I love Facebook’s products, and believe that it could generate a higher than consensus EPS, which will bring down its PEG ratio to less than 1.
- Yahoo – Yahoo’s PEG ratio will be way below 1 if you consider the actual value of its long-term investments in Alibaba and Yahoo Japan.
- Apple – Apple has had a couple of slow growth years, and which may be resulting in the analysts’ estimates for 2015 being too conservative. If you believe, like I do, that Apple may be launching some interesting products in 2014 and 2015, its 10% 2013-2015 CAGR may be too conservative, and the PEG ratio could be lower than 1.
- Twitter – As I explained in my previous article on the stock, Twitter is in the ‘pessimism’ phase, and price trend when compared to post-IPO performance of Facebook and LinkedIn shows upside potential.
Conclusion
If you look only at P/E ratios and ignore potential growth in earnings, you are less likely to invest in startups and high growth companies, and miss out on strong returns; however, these do come with a high level of risk. Also, although the PEG ratio is a good way of identifying investment opportunities, what matters more is whether you believe in the company and its growth potential.
Disclosure: I am long FB, AAPL, YHOO. I wrote this article myself, and it expresses my own opinions. I am not receiving compensation for it (other than from Seeking Alpha). I have no business relationship with any company whose stock is mentioned in this article.
Additional disclosure: I may initiate a long position in Twitter in coming weeks.


28/03/2016 at 4:25 am
I like it when individuals come together and share views. Great website, keep it up!
30/12/2016 at 8:04 am
Oh my goodness! Incredible article dude! Thank you
so much, However I am having complications with your RSS. I don’t understand the reason why I cannot
sign up to it. Could there be anybody having a similar RSS problems?
Anybody who knows the perfect solution could you kindly respond?
Thanks!!